Full Text
Introduction
Epilepsy is a chronic disabling disease with propensity for recurrent seizures. Epilepsy affects around 50 million people worldwide. People with epilepsy have increased mortality compared to general population with cardiovascular disease as a significant risk factor for death as suggested by epidemiological studies.
Epilepsy can be controlled with antiseizure medications (ASMs) [1]. More than 30% of epileptic patients have to undergo long term therapy with ASMs [2].
However, one of the concerns with long term ASMs is their potential to influence cardiovascular health due to various mechanisms, such as metabolic effects, alterations in lipid profiles, and effects on endothelial function. Of note, seizures may occur following cerebrovascular events and especially after major strokes and venous sinus thrombosis [3]. In addition, patients with autoimmune diseases such as systemic lupus erythematosus, Sjogren's syndrome, Crohn's and Behcet's disease, which have been also linked to increased CVD risk can present with epilepsy [4-6]. Seizures may also be the first clinical manifestation of brain arteriovenous malformations, especially when they are located in the frontal and temporal lobes [5]. The most used treatments for epilepsy worldwide are older generation drugs such as phenytoin (PHT), carbamazepine (CBZ), phenobarbital (PB), and valproic acid (VPA), which have prominent enzymatic effects. The association between ASM and CVD morbidity and mortality is not clearly defined. This study was conducted to evaluate the vascular risk factors and carotid atherosclerosis in epileptics who are on long term anti-epileptic therapy.
Materials and methods
This cross-sectional study was conducted at the Department of Neurology, Jubilee Mission Medical College & Research Institute, Thrissur, following approval from institutional ethical committee. The study was conducted for a period of 18 months from July 2020 to January 2022 and was carried out for 86 participants i.e., 43 epilepsy patients and 43 controls after categorizing each variable. Epilepsy patients aged between 18 and 65, receiving ASM monotherapy for more than 2 years were included in the study. Patients who discontinued ASM for more than 2 weeks, patients with Nephrotic syndrome, diabetes mellitus, thyroid and liver disorders were excluded from the study. Common carotid artery IMT (intima media thickness) is measured by B-mode ultrasound system to assess the extent of atherosclerosis. Scanning was done for both the left and right common carotid artery, defined as the 1 cm vascular wall segment of the carotid artery immediately proximal to the dilation of the bifurcation plane. An optimal longitudinal image was saved and the IMT is analyzed using a computerized image analysis system.
Statistical analysis
Statistical analysis was carried out for 86 participants i.e., 43 epilepsy patients and 43 controls after categorizing each variable. Base line data was collected from patients viz age, sex, ASM, dosage duration of ASM, carotid IMT, Lipid profile, BMI, CRP and was analyzed. The significance of difference in mean between two groups was analyzed by student t-test. The correlation between duration of ASM and average carotid IMT was calculated by using the Pearson's correlation coefficient method.
Results
This cross-sectional study was conducted to evaluate the vascular risk factors and carotid atherosclerosis in epileptics who are on long term anti-epileptic therapy. The study subjects were divided in to two groups involving 43 patients as cases and 43 participants as control.
Age wise distribution of participants
It was observed that majority of subjects were in the age group of 25 to 34 years and 35 to 44 years in cases and controls. The distribution of age among cases and control is presented in table 1.
Table 1: Age wise distribution of cases and controls.
|
Age group
|
Group
|
Total
|
Chi square
|
p value
|
|
Cases
|
Controls
|
|
<14
|
6 (14.0)
|
3 (7.0)
|
9 (10.5)
|
3.303
|
0.688
|
|
15-24
|
8 (18.6)
|
9 (20.9)
|
17 (19.8)
|
|
25-34
|
10 (23.3)
|
11 (25.6)
|
21 (24.4)
|
|
35-44
|
10 (23.3)
|
11 (25.6)
|
21 (24.4)
|
|
45-54
|
2 (4.7)
|
5 (11.6)
|
7 (8.1)
|
|
55-64
|
7 (16.3)
|
4 (9.3)
|
11 (12.8)
|
|
Total
|
43
|
43
|
86
|
The mean age of the cases and control was found to be 33.30 ± 15.9 in cases and 34.07 ± 14.2 in control.
Duration and dosage of ASMs in study group
The mean duration of treatment with phenytoin was 6.42 ± 4.69 years with dosage range of 200 – 300mg, carbamazepine was 8.60 ± 4.97 years with dosage range of 400-800mg, sodium valproate was 5.91 ± 3.17 years with dosage range of 400-600mg and phenobarbitone was 8.50 ± 5.12 years with dosage range of 30-60mg (Table 2).
Table 2: Duration and dosage of ASMs in study group.
|
Drug
|
N
|
Mean
|
Dosage range
|
|
Phenytoin (PHT)
|
12
|
6.42 ± 4.69
|
200-300
|
|
Carbamazepine (CBZ)
|
10
|
8.60 ± 4.97
|
400-800
|
|
Sodium valproate (VPT)
|
11
|
5.91 ± 3.17
|
400-600
|
|
Phenobarbitone (PB)
|
10
|
8.50 ± 5.12
|
30-60
|
Effect of phenytoin on atherosclerosis risk factors
The mean BMI value was higher among subjects on phenytoin compared to controls. This difference was found to be statistically significant. The comparison of mean BMI values among control and Phenytoin group is plotted in figure 1.
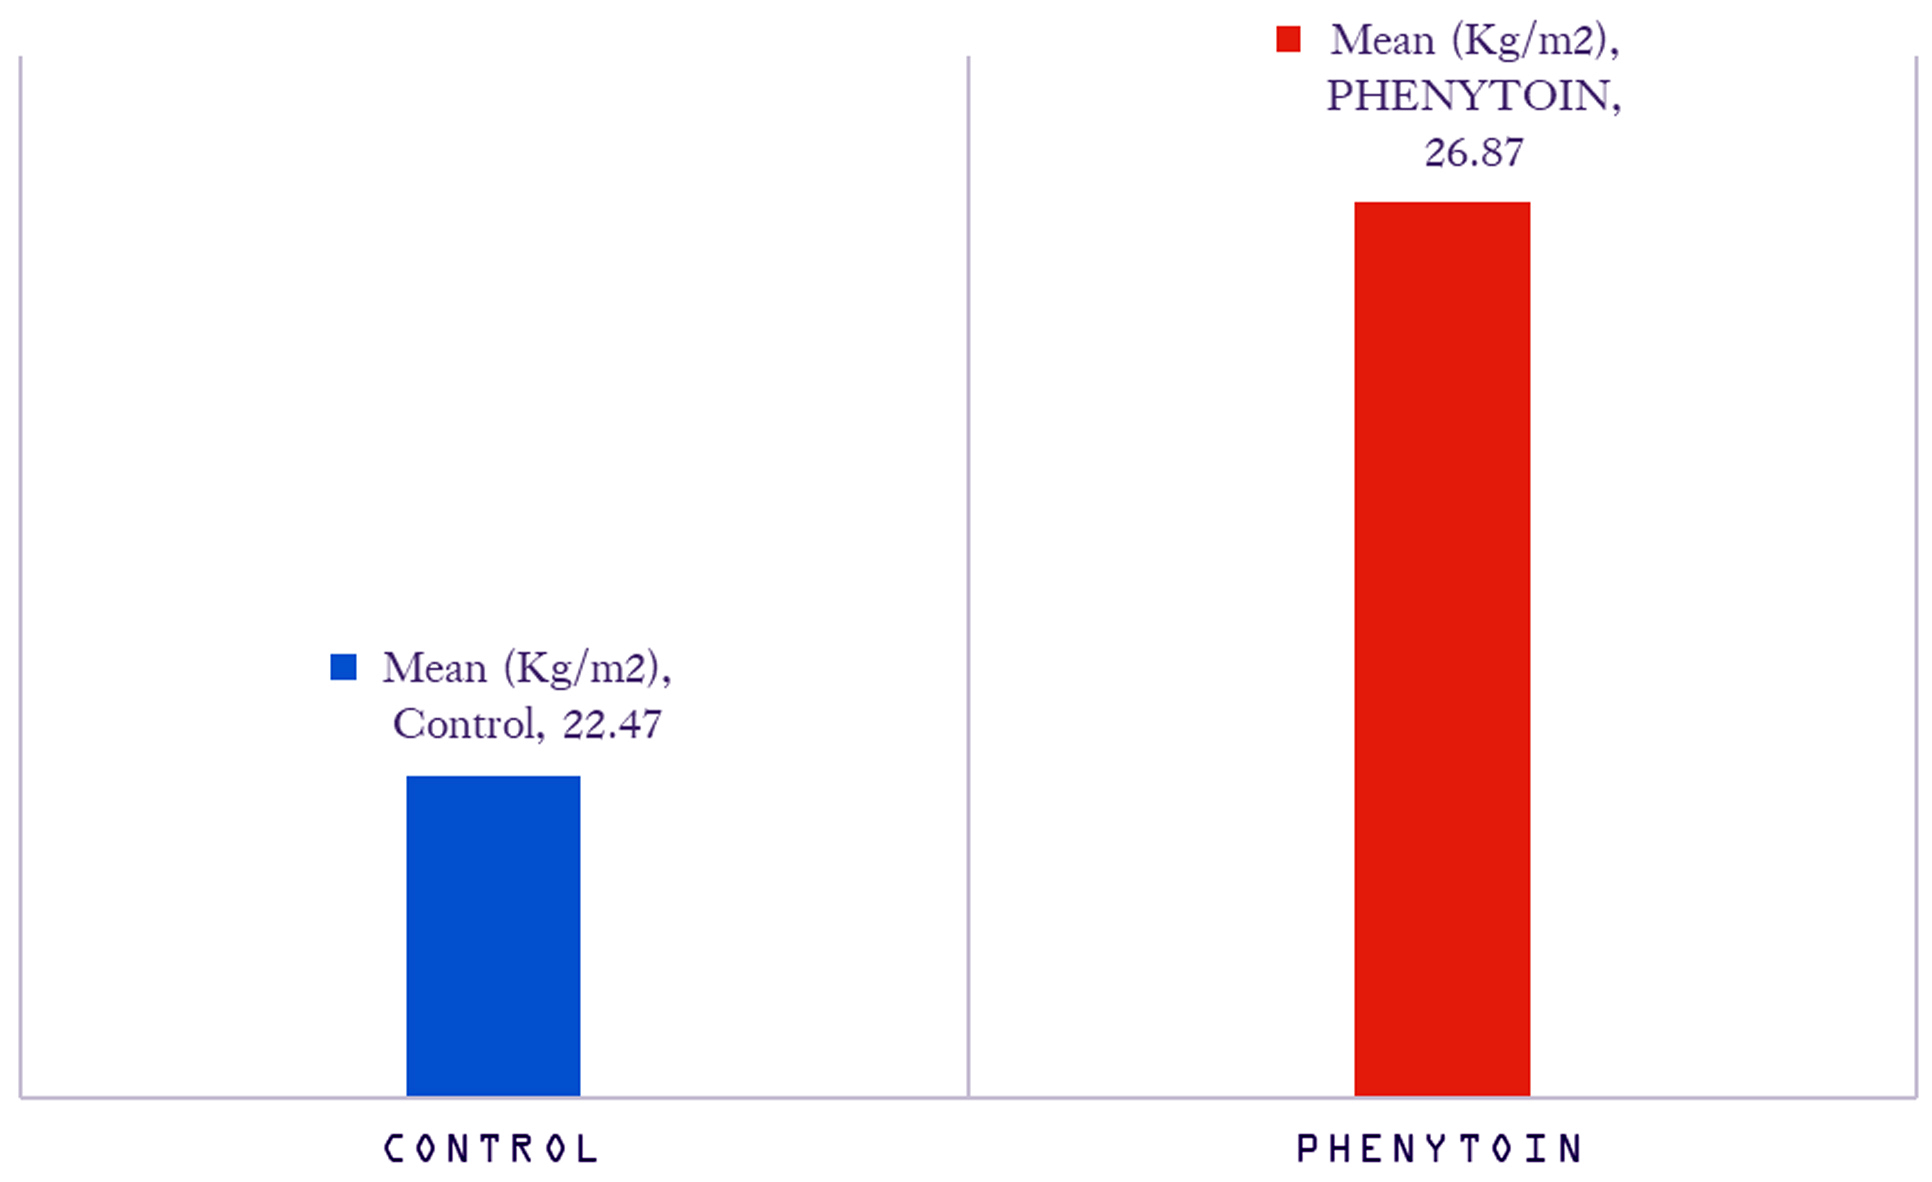
Figure 1: Comparison of mean BMI values of control and phenytoin group.
The mean total cholesterol, HDL levels were slightly higher among subjects consuming phenytoin. Whereas, mean LDL and TGL were slightly higher among controls. The differences were not found to be statistically significant (Table 3).
Table 3: Comparison of mean lipid levels of control and phenytoin group.
|
Lipid level
|
Drug
|
N
|
Mean
|
Std. Deviation
|
t
|
p value
|
|
TC mg%
|
Control
|
43
|
154.58
|
12.955
|
0.348
|
0.729
|
|
Phenytoin
|
12
|
155.92
|
4.795
|
|
LDL mg%
|
Control
|
43
|
99.60
|
11.009
|
0.330
|
0.743
|
|
Phenytoin
|
12
|
98.50
|
6.613
|
|
HDL mg%
|
Control
|
43
|
31.98
|
3.299
|
0.337
|
0.737
|
|
Phenytoin
|
12
|
32.33
|
2.995
|
|
TGL mg%
|
Control
|
43
|
142.21
|
20.160
|
0.059
|
0.954
|
The mean Intima media thickness (IMT) levels on right side and average levels were slightly lower subjects who were consuming phenytoin compared to the controls. On the other hand, mean IMT levels on left side was slightly higher among subjects consuming phenytoin. The differences were not found to be statistically significant (Table 4).
Table 4: Comparison of IMT values between control and phenytoin group in right and left.
|
IMT
|
Drug
|
N
|
Mean
|
Std. Deviation
|
t
|
p value
|
|
IMT-Right
|
Control
|
43
|
1.974
|
0.874
|
0.460
|
0.647
|
|
Phenytoin
|
12
|
0.805
|
0.197
|
|
IMT-Left
|
Control
|
43
|
0.735
|
0.670
|
0.046
|
0.963
|
|
Phenytoin
|
12
|
0.744
|
0.098
|
|
IMT- Average
|
Control
|
43
|
1.354
|
0.437
|
0.456
|
0.650
|
|
Phenytoin
|
12
|
0.774
|
0.114
|
Effect of carbamazepine on atherosclerosis risk factors
The mean BMI value was higher among subjects on carbamazepine compared to controls. This difference was not statistically significant.
The mean total cholesterol, LDL, HDL, TGL levels were higher among subjects taking carbamazepine compared to controls. The differences in levels of TC and TGL were found to be statistically significant (Table 5).
Table 5: Comparison of means lipid levels of control and carbamazepine group.
|
Lipid levels
|
Drug
|
N
|
Mean
|
Std. Deviation
|
t
|
p value
|
|
TC mg%
|
Control
|
43
|
154.58
|
12.955
|
2.93
|
0.005
|
|
Carbamazepine
|
10
|
170.10
|
22.383
|
|
LDL mg%
|
Control
|
43
|
99.60
|
11.009
|
0.751
|
0.456
|
|
Carbamazepine
|
10
|
103.20
|
22.070
|
|
HDL mg%
|
Control
|
43
|
31.98
|
3.299
|
0.450
|
0.655
|
|
Carbamazepine
|
10
|
32.50
|
3.375
|
|
TGL mg%
|
Control
|
43
|
142.21
|
20.160
|
2.519
|
0.015
|
|
Carbamazepine
|
10
|
159.60
|
17.167
|
The mean IMT levels on right and left side and average levels were slightly lower among subjects who were taking carbamazepine compared to controls. The differences were not found to be statistically significant (Table 6).
Table 6: Comparison of means IMT values of control and carbamazepine group.
|
IMT
|
Drug
|
N
|
Mean
|
Std. Deviation
|
t
|
p value
|
|
IMT-Right
|
Control
|
43
|
1.974
|
0.874
|
0.463
|
0.645
|
|
Carbamazepine
|
10
|
0.684
|
0.117
|
|
IMT-Left
|
Control
|
43
|
0.735
|
0.670
|
0.304
|
0.763
|
|
Carbamazepine
|
10
|
0.670
|
0.129
|
|
IMT- Average
|
Control
|
43
|
1.354
|
0.437
|
0.486
|
0.629
|
|
Carbamazepine
|
10
|
0.677
|
0.086
|
Effect of sodium valproate on atherosclerosis risk factors
The mean BMI value was higher among patients on sodium valproate compared to controls. This difference was not statistically significant. Among the lipid profile only triglyceride was found to be higher in the valproate group (p value 0.008) compared to controls. There was no significant difference in carotid IMT between the groups (Table 7).
Table 7: Comparison of means lipid levels of control and valproate group.
|
Lipid levels
|
Drug
|
N
|
Mean
|
Std. Deviation
|
t
|
p value
|
|
TC mg%
|
Control
|
43
|
154.58
|
12.955
|
1.327
|
0.190
|
|
Sodium valproate
|
11
|
160.18
|
10.323
|
|
LDL mg%
|
Control
|
43
|
99.60
|
11.009
|
0.567
|
0.573
|
|
Sodium valproate
|
11
|
97.64
|
6.265
|
|
HDL mg%
|
Control
|
43
|
31.98
|
3.299
|
1.393
|
0.170
|
|
Sodium valproate
|
11
|
33.55
|
3.475
|
|
TGL mg%
|
Control
|
43
|
142.21
|
20.160
|
2.754
|
0.008
|
|
Sodium valproate
|
11
|
160.27
|
15.875
|
Effect of phenobarbitone on atherosclerosis risk factors
The mean BMI value was lower among subjects on phenobarbitone compared to controls and difference was not statistically significant. The mean total cholesterol, LDL, HDL, TGL levels were higher among subjects taking phenobarbitone. The differences in mean TC, HDL and TGL levels were found to be statistically significant. There was no significant difference in carotid IMT between the groups (Table 8).
Table 8: Comparison of mean lipid levels of control and phenobarbitone group.
|
Lipid levels
|
Drug
|
N
|
Mean
|
Std. Deviation
|
t
|
p value
|
|
TC mg%
|
Control
|
43
|
154.58
|
12.955
|
4.432
|
0.001
|
|
Phenobarbitone
|
10
|
176.40
|
18.198
|
|
LDL mg%
|
Control
|
43
|
99.60
|
11.009
|
1.286
|
0.204
|
|
Phenobarbitone
|
10
|
106.10
|
24.637
|
|
HDL mg%
|
Control
|
43
|
31.98
|
3.299
|
2.462
|
0.017
|
|
Phenobarbitone
|
10
|
35.50
|
6.587
|
|
TGL mg%
|
Control
|
43
|
142.21
|
20.160
|
1.898
|
0.020
|
|
Phenobarbitone
|
10
|
154.90
|
12.635
|
The mean IMT levels on right, left side and average levels were slightly lower subjects who were consuming phenobarbitone compared to the controls. The differences were not found to be statistically significant (Table 9).
Table 9: Comparison of mean IMT values of control and phenobarbitone group.
|
IMT
|
Drug
|
N
|
Mean
|
Std. Deviation
|
T
|
p value
|
|
IMT-Right
|
Control
|
43
|
1.974
|
0.874
|
0.451
|
0.645
|
|
Phenobarbitone
|
10
|
0.718
|
0.116
|
|
IMT-Left
|
Control
|
43
|
0.735
|
0.670
|
0.295
|
0.769
|
|
Phenobarbitone
|
10
|
0.672
|
0.096
|
|
IMT- Average
|
Control
|
43
|
1.354
|
0.437
|
0.473
|
0.638
|
|
Phenobarbitone
|
10
|
0.695
|
0.089
|
Antiseizure medications and CRP
The majority of subjects on phenytoin 8 (66.7%) were positive for CRP. There was equal proportion of subjects on carbamazepine were positive and negative for CRP. In rest of the drugs and controls, proportion of subjects with negative CRP were more than positives. There was a statistically significant association between phenytoin consumption and CRP positivity.
Table 10: CRP level between control and ASM group.
|
Drug
|
Group
|
CRP
|
Chi square
|
p value
|
|
Positive
|
Negative
|
|
Phenytoin
|
Control
|
12 (27.9)
|
31 (72.1)
|
6.0909
|
0.013
|
|
Cases
|
8 (66.7)
|
4 (33.3)
|
|
Carbamazepine
|
Control
|
12 (27.9)
|
31 (72.1)
|
1.8176
|
0.177
|
|
Cases
|
5 (50.0)
|
5 (50.0)
|
|
Sodium valproate
|
Control
|
12 (27.9)
|
31 (72.1)
|
0.1124
|
0.737
|
|
Cases
|
3 (27.3)
|
8 (72.7)
|
|
Phenobarbitone
|
Control
|
12 (27.9)
|
31 (72.1)
|
0.1353
|
0.712
|
|
Cases
|
4 (40.0)
|
6 (60.0)
|
Correlation between duration of ASM and average IMT
There was positive correlation between duration of phenytoin consumption and average IMT. This correlation was not statistically significant. There was a strong positive correlation between duration of phenobarbitone consumption and average IMT, this correlation was statistically significant (Table 11).
Table 11: Correlation between duration of ASM and average IMT.
|
Drug
|
Pearson’s correlation
|
p value
|
|
Phenytoin
|
0.462
|
0.130
|
|
Carbamazepine
|
0.167
|
0.644
|
|
Sodium valproate
|
0.180
|
0.597
|
|
Phenobarbitone
|
0.682
|
0.030
|
Discussion
Cardiac morbidity and mortality are known to be higher in epilepsy, the exact cause for this association is unknown. The causal role of ASM in cardiac morbidity and mortality of people with epilepsy remains controversial. This cross-sectional study was carried out with an aim to investigate the effects of long-term ASMs on vascular risk factors and atherosclerosis.
The study subjects were divided in to two groups involving 43 participants as control and 43 patients as cases. The mean age of the cases and control was found to be 33.30 ± 15.896 in cases and 34.07 ± 14.155 in control, age range was similar in previously conducted studies [7-8].
Long-term ASM therapy may result in low-grade systemic inflammation and increase in oxidative stress, as manifested by higher concentrations of hs-CRP and TBARS [9-10]. Chronic production of reactive oxygen species may exceed the capacity of cellular antioxidants, resulting in oxidative modification of LDL-C, promotion of proinflammatory responses, recruitment of macrophage, and development of atherosclerotic lesion [11]. Moreover, hs-CRP has been found to induce the expression of cytokines and cell adhesion molecules, which are recognized activators of the extrinsic pathway of the coagulation system [12-13]. In the present study the majority of subjects on phenytoin 8 (66.7%) were positive for CRP, but a similar effect was not observed with other antiepileptic medications tested.
There was positive correlation between duration of phenytoin consumption and average IMT. There was a strong positive correlation between duration of phenobarbitone consumption and average IMT, this correlation was statistically significant.
In our study, the mean BMI value was significantly higher among subjects on phenytoin only. Dyslipidemia has long been known to be an important risk factor for atherosclerosis [13]. In the study of Chuang et al the body mass index (BMI) was significantly higher in the PHT and VPA groups when compared with controls, but insignificant in the LTG and CBZ groups [8].
LDL-C increase atherosclerosis by multiple mechanism including changing endothelial permeability, accumulation of lipoproteins within the intima of blood vessels, increase in inflammatory cells, and formation of foam cells.
Emerging evidence further showed that treatment with enzyme-inducing ASMs, such as CBZ and PHT, is significantly associated with increased blood levels of total cholesterol, atherogenic (non-HDL) cholesterol, triglycerides, and tHcy [9, 14, 15]. In the current study there was no definite relation between LDL-C and ASMs, however Total cholesterol and triglyceride shows statistically significant association with CBZ and phenobarbitone. Triglyceride alone was high in patients on sodium valproate. In previous studies effects of VPA on changes in lipid profiles and lipoproteins remains controversial [15-18].
Prospective and retrospective incidence cohort studies have established that patients with epilepsy carry a significantly higher mortality rate than the general population [19-21]. Whereas cardiovascular disease is not considered a contributing factor [19-21]. A number of studies reported an elevated standardized mortality ratio for patients with epilepsy to die of cerebrovascular diseases that are related to atherosclerosis [20-22]. However, few data exist regarding the long-term effects of specific ASMs on vascular events. One previous study revealed that the IMT of CCA was significantly increased in patients with long-term ASM therapy [10]. In the present study there was a positive correlation between IMT and duration of intake of phenobarbitone, such an effect was not noted for other ASMs.
Limitations: The study was conducted in a tertiary referral centre which may not reflect the general population. This is a single centre study with limited number of patients, multicentric study with a greater number of patients would have given more robust data. The study did not include newer ASM
Conclusion
ASMs like phenytoin causes inflammatory milieu as evidenced by increased CRP, which increases the chance for atherosclerosis. There was positive correlation between duration of phenytoin consumption and average IMT. There was a strong significant positive correlation between duration of phenobarbitone consumption and average IMT. Our results also suggest that long-term use of older-generation ASMs with prominent effects on the enzyme system, like phenytoin and phenobarbitone may contribute to the progression of atherosclerosis in patients with epilepsy. This information offers a guide for the choice of drug for patients with epilepsy who require long-term ASM therapy, particularly in aged and high-risk individuals.
Conflicts of interest
Authors declare no conflicts of interest.
References
[1] Epilepsy. Accessed on June 24, 2023 from: https://www.who.int/news-room/fact-sheets/detail/epilepsy
[2] Wahab A. Difficulties in treatment and management of epilepsy and challenges in new drug development. Pharmaceuticals. 2010; 3:2090–2110.
[3] Obata K, Sato K, Ohara H, Kinoshita M. Cerebrovascular disease; A leading cause of epilepsy. In epilepsy-update on classification, etiologies, instrumental diagnosis and treatment 2020 Dec 9. IntechOpen. Available from: https://www.intechopen.com/chapters/74373
[4] Szałwińska K, Cyuńczyk M, Kochanowicz J, Witkowska AM. Dietary and lifestyle behavior in adults with epilepsy needs improvement: a case-control study from northeastern Poland. Nutrition J. 2021; 20:1–4.
[5] Miguel A, Martínez, González MA, Gea A, Ruiz-Canela M, et al. The Mediterranean diet and cardiovascular health: A critical review. Circul Res. 2019; 124:779–798.
[6] Sapkota S, Kobau R, Croft JB, King BA, Thomas C, Zack MM et al. Prevalence and trends in cigarette smoking among adults with epilepsy—United States, 2010–2017. Morbidity and Mortality Weekly Report. 2020; 69:1792.
[7] Chen NC, Chen CH, Lin TK, Chen SD, Tsai MH, et al. Risk of microangiopathy in patients with epilepsy under long-term antiepileptic drug therapy. Front Neurol. 2018; 9:113.
[8] Chuang YC, Chuang HY, Lin TK, Chang CC, Lu CH, et al. Effects of long‐term antiepileptic drug monotherapy on vascular risk factors and atherosclerosis. Epilepsia. 2012; 53:120–128.
[9] Mintzer S, Mattson RT. Should enzyme‐inducing antiepileptic drugs be considered first‐line agents? Epilepsia. 2009; 50:42–50.
[10] Tan TY, Lu CH, Chuang HY, Lin TK, Liou CW, et al. Long‐term antiepileptic drug therapy contributes to the acceleration of atherosclerosis. Epilepsia. 2009; 50:1579–1586.
[11] Stocker R, Keaney JF. Role of oxidative modifications in atherosclerosis. Physiological reviews. 2004; 84:1381–1478.
[12] Ridker PM. Inflammation, infection, and cardiovascular risk: how good is the clinical evidence?. Circulation. 1998; 97:1671–1674.
[13] Kullo IJ, Ballantyne CM. Conditional risk factors for atherosclerosis. InMayo Clinic Proceedings. 2005; 2:219–230.
[14] Svalheim S, Luef G, Rauchenzauner M, Mørkrid L, Gjerstad L, et al. Cardiovascular risk factors in epilepsy patients taking levetiracetam, carbamazepine or lamotrigine. Acta Neurologica Scandinavica. 2010; 122:30–33.
[15] Eiris JM, Lojo S, Del Rio MC, Novo I, Bravo M, et al. Effects of long‐term treatment with antiepileptic drugs on serum lipid levels in children with epilepsy. Neurol. 1995; 45:1155–1157.
[16] Geda G, Caksen H, Icagasioglu Dİ. Serum lipids, vitamin B12 and folic acid levels in children receiving long-term valproate therapy. Acta Neurologica Belgica. 2002; 102:122–126.
[17] Pylvänen V, Pakarinen A, Knip M, Isojärvi J. Insulin-related metabolic changes during treatment with valproate in patients with epilepsy. Epilepsy Behavior. 2006; 8:643–648.
[18] LoPinto-Khoury C, Mintzer S. Antiepileptic drugs and markers of vascular risk. Current treatment options in neurology. 2010; 12:300–308.
[19] Lhatoo SD, Johnson AL, Goodridge DM, MacDonald BK, Sander JW, et al. Mortality in epilepsy in the first 11 to 14 years after diagnosis: multivariate analysis of a long‐term, prospective, population‐based cohort. Annals Neurol. 2001; 49:336–344.
[20] Jallon P. Mortality in patients with epilepsy. Current opinion in neurology. 2004; 17:141–146.
[21] Mohanraj R, Norrie J, Stephen LJ, Kelly K, Hitiris N, et al. Mortality in adults with newly diagnosed and chronic epilepsy: a retrospective comparative study. Lancet Neurol. 2006; 5:481–487.
[22] Cockerell OC, Hart YM, Sander JW, Goodridge DM, Shorvon SD, et al. Mortality from epilepsy: results from a prospective population-based study. Lancet. 1994; 344:918–921.